Why We Ended up Using WinDbg
Why WinDbg? We recently had the opportunity to venture into the area of multi-threaded worker roles. The consideration behind the idea was that there are a number of distinct, but relatively small and quick tasks that should be dealt with by a single, small, Azure virtual machine instance, rather than having several separate ones designated for one specific aim. All seemed good and happy in theory if only practice would be that simple…
When we deployed our solution, initially all the worker roles started up fine, but over the course of a day (or several hours at least), they slowed down, and then stopped responding whatsoever. On the Azure management portal, the given instance’s status was unhealthy with the little extra message:“Role cannot be reached by the host system”. Every now and then, Azure tried to restart the role, but since it was unreachable, it was all in vain.
We tried to figure out what the issue is, and after taking a look at the WADPerformanceCountersTable – a log for the machine’s hardware status counters, e.g. CPU usage – we found that the machines essentially run out of free memory: an A1 instance has 1.75 GB of RAM in total, and after letting our role running for a day the free, usable space would decrease to 25-40 megabytes. Which was less than enough for the Azure heartbeat service to properly operate, so it timed out and sent a message – I can’t reach the process, fix me. So we found the issue: a memory leak. But where was it?
Initially, we went through the code with a fine comb to see if we could find any clangers, but we did not succeed this way. We’d need to go a level deeper and take a look at what exactly is our memory full of that Garbage Collector cannot take care of. Enter WinDbg.
Tutorial
First, take a memory dump of the failing process: in the case of an Azure worker role, it’s the WaWorkerHost.exe on the virtual machine. To do so, RDP onto the Cloud Service, open up Task Manager, go to details, right-click on the process and select “Create memory dump”.

This will create a DMP file that can be analysed. If you haven’t already done so, install WinDbg on a machine – it is included in the Windows Driver Kit that can be downloaded from Microsoft – and start up the version that corresponds to your application (32 or 64 bit).
After starting up, open your DMP file (File > Open Crash Dump…). If you’re analysing your dump file on the machine that was building your solution then all the symbol files (*.pdb) should be already in the correct place where it would look for them. However, if you are using WinDbg on a different computer or if you have since moved the files, you can set the correct path using the File menu > Symbol File Path… or the .sympath and .symfix commands. (usually it’s the project’s /<configuration>/bin directory). The next command you need is:
.reload -f
This will take a while since it will try to load in all the correct PDB files for all the DLLs referenced in the memory heap. Take a look at the messages you get. If you get ERROR messages for your own libraries, it indicates that WinDbg is unable to find the symbol files. This means you’ll end up with an incomprehensible output which makes debugging hard. You can get
...........*** WARNING: Unable to verify checksum for My.Awesome.Project.dll
messages, this can mean that the version of the dll is different from the pdb file, or that the compilation was done without the /RELEASE option. Note: if you ever have to cancel out a command while running it in WinDbg, you can do so by pressing CTRL + Break on your keyboard, or go to Debug > Break
Next step is to load the debugger extension for managed code. You can use the
.loadby sos clr (in .Net 4.0+)
command. It may fail if the machine where you’ve taken your dump from has a different place for the sos.dll than the build machine (in Azure the system drive by default is D, not C). In this case, you get an error, but don’t worry you can load the file manually by calling:
.load c:\windows\Microsoft.NET\Framework64\v4.0.30319\sos.dll
with the correct file path, of course. Once you’ve loaded the dll, you can run !help to see the list of commands available for debugging. The first you should call is !VerifyHeap to check if the memory dump is good to use (e.g. GC was not actively running on it and cleaning it up at the moment of snapshot). Then you can call:
!eeheap -gc
this will give you some basic information – the size of your GC heap for instance which may indicate problems if too big. In our case it was over 2.2 gbs so we went further on with:
!dumpheap -stat
which will give you a table of all the objects loaded in the memory heap – grouped by type, such as:
0:000> !dumpheap -stat
Statistics:
              MT    Count    TotalSize Class Name
000007fda9ee41e8        1           24 System.Collections.Generic.Dictionary`2+KeyCollection[[System.String, mscorlib],[NHibernate.Engine.Query.NamedParameterDescriptor, NHibernate]]
000007fda9ee35c8        1           24 System.Collections.Generic.ObjectEqualityComparer`1[[NHibernate.Param.NamedParameterSpecification, NHibernate]]
000007fda9ea74d8        1           24 System.Collections.Generic.ObjectEqualityComparer`1[[NHibernate.Hql.Ast.ANTLR.Tree.IASTNode, NHibernate]]
000007fda9e43c10        1           24 NHibernate.Linq.Visitors.ResultOperatorProcessors.ResultOperatorProcessor`1[[Remotion.Linq.Clauses.ResultOperators.CastResultOperator, NHibernate]]
000007fda9e43b08        1           24 NHibernate.Linq.Visitors.ResultOperatorProcessors.ResultOperatorProcessor`1[[Remotion.Linq.Clauses.ResultOperators.OfTypeResultOperator, NHibernate]]
000007fda9e43a00        1           24 NHibernate.Linq.Visitors.ResultOperatorProcessors.ResultOperatorProcessor`1[[NHibernate.Linq.TimeoutResultOperator, NHibernate]]
...
The first column is the ID of the type. The second column is the number of such objects, followed by the shallow size of all such objects, and at last the name. Take a look at the bottom of the list:
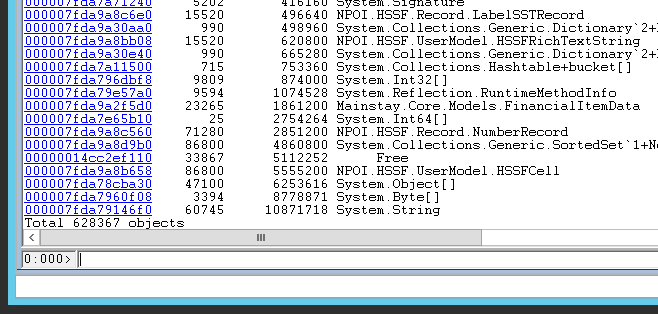
We found that most of our objects were mere strings. If you click on the first column for it, or type
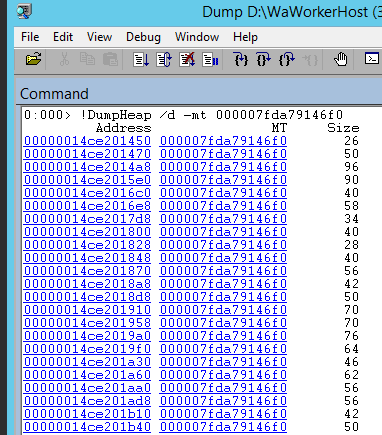
!DumpHeap /d -mt
you’ll get a list of all the actual objects of such type loaded into the memory dump.
Clicking on the Address of any of them, or running !DumpObj /d <address> will give you details about the actual object, including its actual value: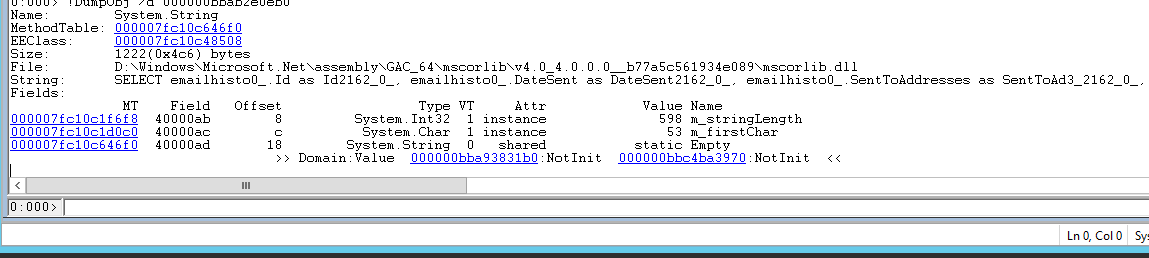
We looked into the strings which were larger than ~300 bytes to see if there was any pattern. We found that nearly all of them were SQL statements, similar to the one pictured above. In order to figure out where these strings were coming from, or which other object are they related to, you can run !gcroot <address> of the object, and get a result similar to this.
The stack is to be read from the bottom to up. We got suspicious that there was something in our NHibernate configuration which was caching these queries and not deleting them. Now, NHibernate has two caches in the version we use: session level caches, and sessionfactory level caches. If you take a look at the stack above, you can see the line: “-> 000000bbb03c8288 NHibernate.Impl.SessionFactoryImpl” indicating that this string is tied to a session factory instance, so our next step was to figure out the “deep” size of our session factory instance with !objsize <address>. This command will enumerate the object, its properties + referenced objects’ sizes. After running this on the session factory instance we got a result of ~7.5 megabytes, which is not awfully bad. So naturally, we went to see if there’s something else in it, and therefore we ran !dumpheap -type NHibernate.Impl.SessionFactoryImpl, which gives us a list of all the objects in the given type, and this is what we’ve found: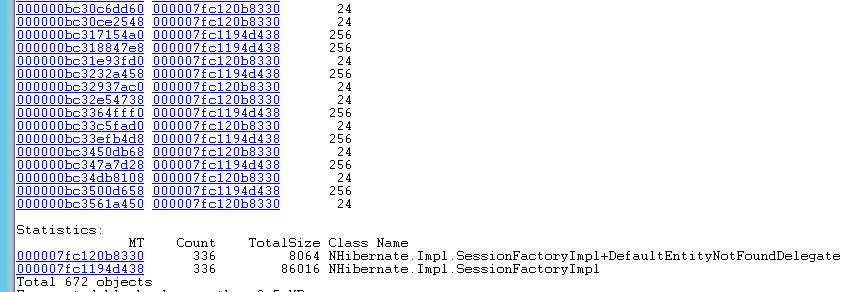
There were 336 instances of NHibernate SessionFactory loaded in the memory. This indicated that there’s something actually wrong about how we instantiate them. We should not have this many loaded up. Even creating a new one for each of the running threads we should finished with a number under 10. Each of these instances consumed roughly 7.5-8 megs of memory. From this, we figured out what was leaking. This meant now we could go back to the code to find where it does it.
…
It turns out we had a static method that called out to Autofac for a SessionFactory instance every 5 minutes. This actually ended up getting a completely new instance every time. Changing the autofac configuration to a single instance for this type corrected the behaviour.
Further similar cases worth reading and learning from:
- A WinDbg Debugging Journey – NHibernate Memory Leak
- Debugging managed code memory leak with memory dump using winDbg
Get Coding!
Remember if you need assistance, have a look at out Azure Cloud page or use our contact form.
Alternatively, give us a call at +353 (0)1 818 2949
Â
Greenfinch Technology